Exhibit 3-13 Supply and demand curves 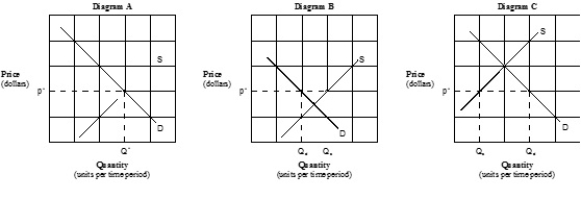
- Which of the graphs in Exhibit 3-13 illustrates a shortage exists at the indicated market price?
A) Diagram A.
B) Diagram B.
C) Diagram C.
D) Diagrams A and B.
Correct Answer:
Verified
Q283: Exhibit 3-14 Supply and demand curves
Q284: Exhibit 3-16 Supply and demand curves
Q285: Exhibit 3-12 Supply and demand data
Q286: Exhibit 3-15 Supply and demand curves for
Q287: Exhibit 3-11 Demand and supply curves
Q289: Exhibit 3-12 Supply and demand data
Q290: Exhibit 3-12 Supply and demand data
Q291: Exhibit 3-11 Demand and supply curves
Q292: Exhibit 3-15 Supply and demand curves for
Q293: Exhibit 3-15 Supply and demand curves for
Unlock this Answer For Free Now!
View this answer and more for free by performing one of the following actions

Scan the QR code to install the App and get 2 free unlocks

Unlock quizzes for free by uploading documents