Exhibit 1A-10 Multi-curve graph
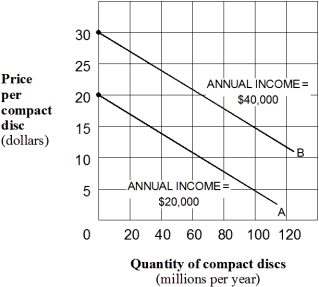
-Exhibit 1A-10 represents a three-variable relationship.As the annual income of consumers rises from $20,000 (line A) to $40,000 (line B) ,the result is a(n) :
A) rightward movement along each curve.
B) leftward movement along each curve.
C) leftward shift in curve B to curve A.
D) leftward shift in curve A to curve B.
Correct Answer:
Verified
Q40: A shift in a curve represents a
Q51: A two-dimensional graph can only represent the
Q53: Exhibit 1A-9 Multi-curve graph Q57: Exhibit 1A-8 Straight line relationship Q59: Exhibit 1A-7 Straight line relationship Q223: Exhibit 1A-6 Straight line Q224: Exhibit 1A-7 Straight line relationship Q232: Exhibit 1A-6 Straight line Q238: A graph is one method of expressing Q251: If two variables are inversely related, then Unlock this Answer For Free Now! View this answer and more for free by performing one of the following actions Scan the QR code to install the App and get 2 free unlocks Unlock quizzes for free by uploading documents
![]()

![]()

![]()

