Exhibit 3-3 Demand curves 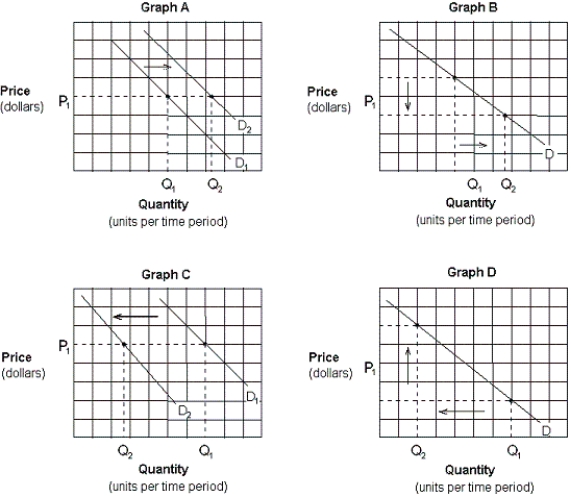
-Which of the graphs in Exhibit 3-3 depicts the effect of a decrease in the price of pizza on the demand curve for pizza?
A) Graph A.
B) Graph B
C) Graph C.
D) Graph D.
Correct Answer:
Verified
Q65: In accordance with the law of supply,
Q72: Which of the following states the definition
Q167: Complementary goods are goods:
A) that are consumed
Q168: In general, supply curves slope upward because:
A)
Q170: Exhibit 3-3 Demand curves Q173: Two goods, X and Y, are complementary Q174: There is news that the price of Q175: Exhibit 3-3 Demand curves Q176: According to the law of supply, there Q177: The supply schedule shows the specific quantity![]()
![]()
Unlock this Answer For Free Now!
View this answer and more for free by performing one of the following actions

Scan the QR code to install the App and get 2 free unlocks

Unlock quizzes for free by uploading documents