Exhibit 3-3 Demand curves 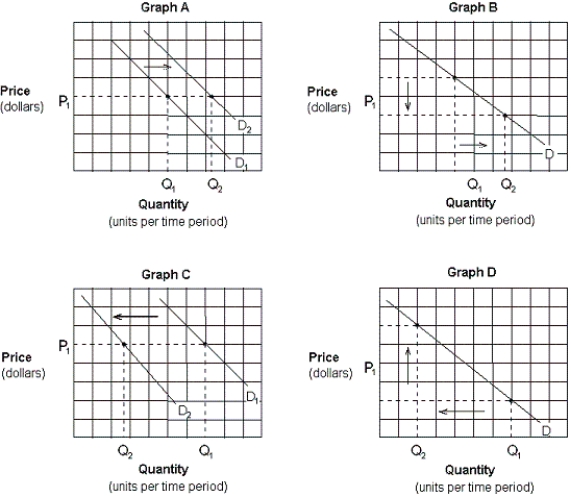
-Which of the graphs in Exhibit 3-3 depicts the effect of an increase in income on the demand for pork and beans (an inferior good) ?
A) Graph A.
B) Graph B.
C) Graph C.
D) Graph D.
Correct Answer:
Verified
Q96: Which of the following will cause a
Q174: There is news that the price of
Q175: Exhibit 3-3 Demand curves Q176: According to the law of supply, there Q177: The supply schedule shows the specific quantity Q180: Assume that peanut butter and jelly are Q181: A technological improvement in producing good A Q184: Which of the following corresponds to the Q269: How will an increase in lumber prices Q284: According to the law of supply,![]()
A) more
Unlock this Answer For Free Now!
View this answer and more for free by performing one of the following actions

Scan the QR code to install the App and get 2 free unlocks

Unlock quizzes for free by uploading documents