Exhibit 3-4 Supply curves
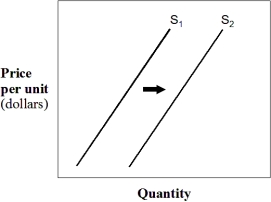
-In Exhibit 3-4,a shift in the supply curve from S₁ to S₂ represents a(n) :
A) decrease in supply.
B) decrease in the quantity supplied.
C) increase in supply.
D) increase in the quantity supplied.
E) increase in demand.
Correct Answer:
Verified
Q122: Which of the following would not cause
Q125: Assuming that soybeans and tobacco can both
Q130: An improvement in a firm's technology that
Q134: A technological improvement in the production of
Q137: "Because of unseasonable cold weather, much of
Q224: Which of the following will increase the
Q225: Assuming that wheat and corn can both
Q230: Exhibit 3-5 Supply for Tucker's Cola
Q234: An advance in technology results in:
A) suppliers
Q240: A reduction in production costs will result
Unlock this Answer For Free Now!
View this answer and more for free by performing one of the following actions

Scan the QR code to install the App and get 2 free unlocks

Unlock quizzes for free by uploading documents