Exhibit 3-4 Supply curves
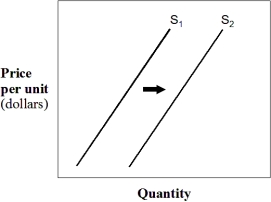
-In Exhibit 3-4,which of the following could have caused the shift in the supply curve from S₁ to S₂?
A) Increase in demand.
B) Decrease in demand.
C) Decrease in the number of suppliers in the market.
D) Decrease in wage rates.
E) Increase in materials cost.
Correct Answer:
Verified
Q111: Farmers can produce wheat and/or rice. What
Q127: Which of the following would decrease the
Q132: Assume that oranges and peaches can both
Q202: Which of the following would increase the
Q204: An increase in the supply of the
Q208: Seller A, has an upward-sloping supply curve,
Q224: Which of the following will increase the
Q233: Which of the following explain better the
Q237: Which of the following has a direct
Q254: A surplus occurs when the:
A) quantity demanded
Unlock this Answer For Free Now!
View this answer and more for free by performing one of the following actions

Scan the QR code to install the App and get 2 free unlocks

Unlock quizzes for free by uploading documents