Exhibit 5-8 Supply and demand curves for good X
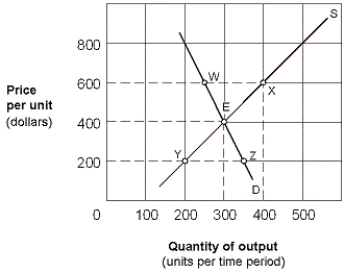
-As shown in Exhibit 5-8, the price elasticity of demand for good X between points E and Z is:
A) 3/13 = 0.23.
B) 13/3 = 4.33.
C) 1/3 = 0.33.
D) 1.
Correct Answer:
Verified
Q116: The price elasticity of demand between rifles
Q131: If the price elasticity is supply coefficient
Q204: Price elasticities of supply are always:
A) the
Q206: In the very short-run period,
A) the price
Q207: Exhibit 5-8 Supply and demand curves for
Q208: The responsiveness of suppliers to changing prices
Q210: The value of cross elasticity of demand
Q212: Exhibit 5-8 Supply and demand curves for
Q213: If the price elasticity of supply equals
Q214: If a tripling of price triples the
Unlock this Answer For Free Now!
View this answer and more for free by performing one of the following actions

Scan the QR code to install the App and get 2 free unlocks

Unlock quizzes for free by uploading documents