Exhibit 7-2 Total revenue and total cost graph
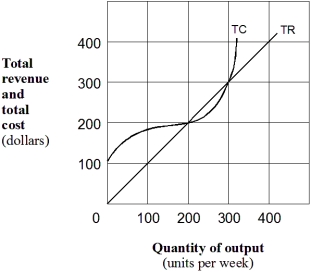
-In Exhibit 7-2,economic profit for the firm is at a maximum when output per week equals:
A) zero units.
B) 100 units.
C) 200 units.
D) 250 units.
E) 300 units.
Correct Answer:
Verified
Q69: If a firm in a competitive industry
Q84: Which of the following is a firm's
Q100: As market price increases in the short
Q101: A perfectly competitive firm's supply curve follows
Q102: Exhibit 7-3 Cost per unit curves
Q103: Exhibit 7-3 Cost per unit curves
Q104: Exhibit 7-3 Cost per unit curves
Q106: Exhibit 7-3 Cost per unit curves
Q108: Exhibit 7-4 Marginal cost and revenue for
Q110: A perfectly competitive firm's short-run supply curve
Unlock this Answer For Free Now!
View this answer and more for free by performing one of the following actions

Scan the QR code to install the App and get 2 free unlocks

Unlock quizzes for free by uploading documents