Exhibit 7-2 Total revenue and total cost graph
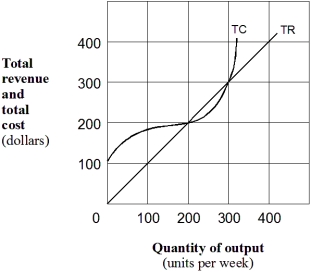
-At an output of 250 units,as shown in Exhibit 7-2,marginal cost is:
A) greater than marginal revenue.
B) equal to marginal revenue.
C) less than marginal revenue.
D) none of the above.
Correct Answer:
Verified
Q82: Suppose that 1000 identical sellers each set
Q89: Above the shutdown point, a competitive firm's
Q93: If a competitive firm is losing money
Q104: A perfectly competitive firm's short-run supply curve
Q108: A perfectly competitive firm's short-run supply curve
Q116: Exhibit 7-4 Marginal cost and revenue for
Q121: Exhibit 7-4 Marginal cost and revenue for
Q122: Exhibit 7-5 A firm's MR and MC
Q123: Exhibit 7-7 A firm's cost and MR
Q161: The supply curve of a price-taker firm
Unlock this Answer For Free Now!
View this answer and more for free by performing one of the following actions

Scan the QR code to install the App and get 2 free unlocks

Unlock quizzes for free by uploading documents