Exhibit 10-3 Supply and demand curves for food servers
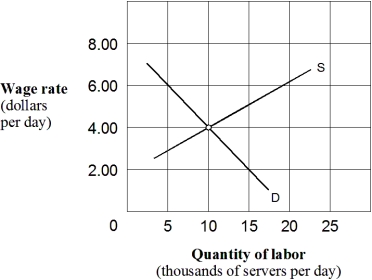
-In Exhibit 10-3,the equilibrium wage and the number of food servers employed per day,respectively,are:
A) $2.00 and 5 thousand.
B) $4.00 and 10 thousand.
C) $6.00 and 15 thousand
D) $8.00 and 20 thousand.
Correct Answer:
Verified
Q18: One reason the supply of carpenters is
Q44: An increase in the demand for a
Q47: Exhibit 10-2 Labor supply curve

Q56: Suppose a change in technology increases the
Q59: An individual firm in a competitive labor
Q60: The labor supply curve facing an individual
Q70: If more and better technology is used
Q76: Which of the following determines equilibrium wages
Q93: An increase in demand for French fries
Q100: A decrease in the marginal product of
Unlock this Answer For Free Now!
View this answer and more for free by performing one of the following actions

Scan the QR code to install the App and get 2 free unlocks

Unlock quizzes for free by uploading documents