Exhibit 10-7 Income distribution for three countries
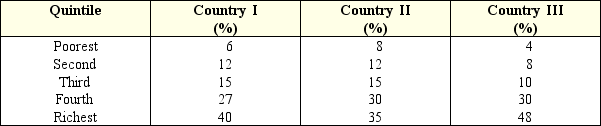
-Exhibit 10-7 shows the percentage of income received by each population quintile.From this chart we can conclude:
A) Country I has the most unequal income distribution.
B) Country III has the most equal income distribution.
C) Country II has the most unequal income distribution.
D) Country II has the most equal income distribution.
E) Country III has a more equal income distribution than Country II.
Correct Answer:
Verified
Q42: Which of the following is not included
Q48: Of the following demographic groups, which has
Q60: The social security tax is called FICA,
Q60: The social security tax is called FICA,
Q66: The Social Security Act was passed:
A) in
Q78: Exhibit 12-8 Negative income tax for a
Q78: Exhibit 12-8 Negative income tax for a
Q107: Exhibit 10-7 Income distribution for three countries
Q115: Exhibit 10-7 Income distribution for three countries
Q137: Which of the following statements is correct
Unlock this Answer For Free Now!
View this answer and more for free by performing one of the following actions

Scan the QR code to install the App and get 2 free unlocks

Unlock quizzes for free by uploading documents