Multiple Choice
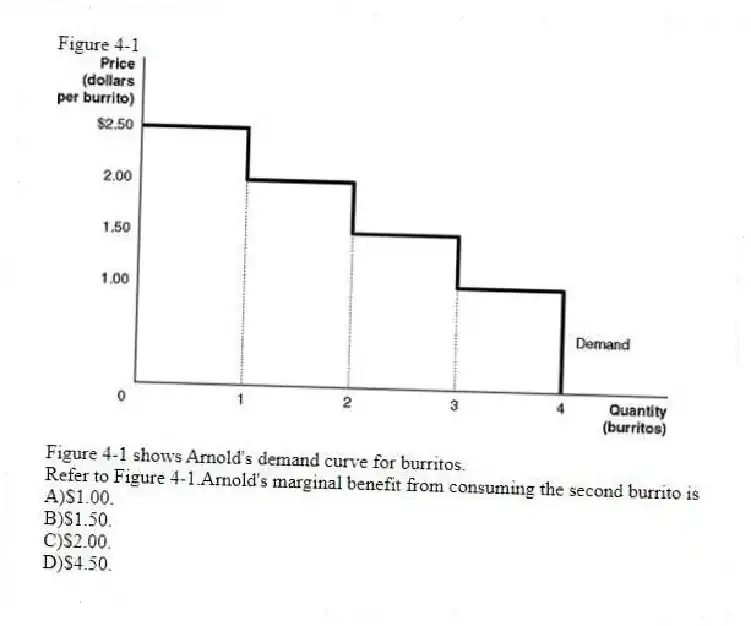
Figure 4-1

Figure 4-1 shows Arnold's demand curve for burritos.
-Refer to Figure 4-1.Arnold's marginal benefit from consuming the second burrito is
A) $1.00.
B) $1.50.
C) $2.00.
D) $4.50.
Correct Answer:
Verified
Related Questions
Q30: The area _ the market supply curve
Q31: Table 4-3 Q32: Figure 4-1 Q33: Table 4-3 Q34: Table 4-3 Q36: A _ curve shows the marginal cost Q37: Table 4-3 Q38: Which of the following statements is true? Q39: Figure 4-1 Q40: Figure 4-1 Unlock this Answer For Free Now! View this answer and more for free by performing one of the following actions Scan the QR code to install the App and get 2 free unlocks Unlock quizzes for free by uploading documents
![]()
![]()
![]()
![]()
![]()
A)Consumer
![]()
![]()

