Multiple Choice
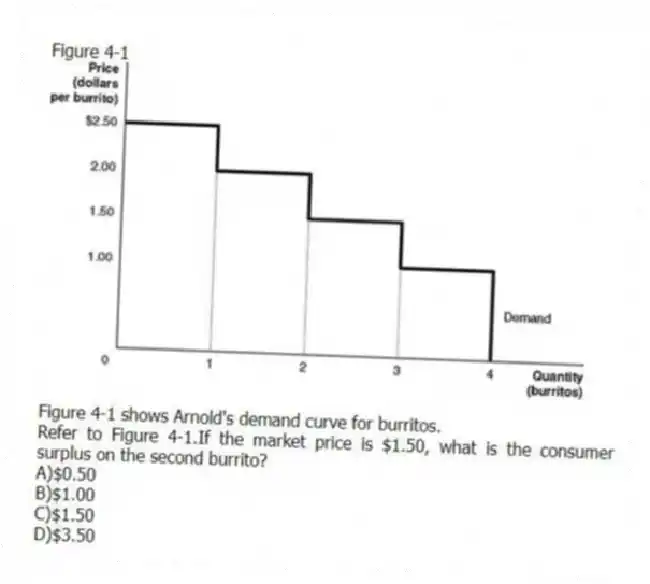
Figure 4-1

Figure 4-1 shows Arnold's demand curve for burritos.
-Refer to Figure 4-1.If the market price is $1.50, what is the consumer surplus on the second burrito?
A) $0.50
B) $1.00
C) $1.50
D) $3.50
Correct Answer:
Verified
Related Questions
Q17: Table 4-1 Q18: In a city with rent-controlled apartments, all Q19: Each point on a _ curve shows
![]()

