Multiple Choice
Figure 4-5 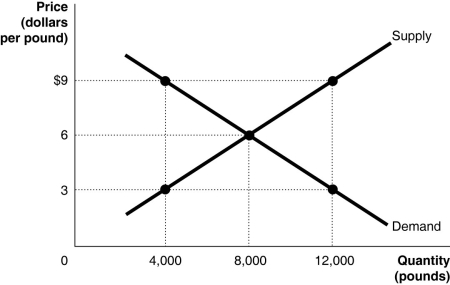
-Refer to Figure 4-5. The figure above represents the market for pecans. Assume that this is a competitive market. If the price of pecans is $9
A) economic surplus is maximized.
B) too many consumers want to buy pecans.
C) the quantity supplied is greater than the economically efficient quantity.
D) the quantity demanded is economically efficient but the quantity supplied is economically inefficient.
Correct Answer:
Verified
Related Questions

