Table 4-7
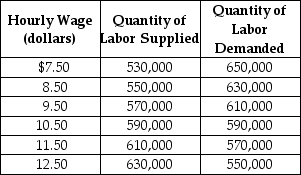 Table 4-7 shows the demand and supply schedules for the labor market in the city of Pixley.
-Refer to Table 4-7. Suppose that the quantity of labor supplied increases by 40,000 at each wage level. What are the new free market equilibrium hourly wage and the new equilibrium quantity of labor?
A) W = $8.50; Q = 550,000
B) W = $12.50; Q = 630,000
C) W = $9.50; Q = 610,000
D) W = $11.50; Q = 610,000
Correct Answer:
Verified
Q91: The difference between consumer surplus and producer
Q92: If marginal benefit is greater than marginal
Q103: When a competitive equilibrium is achieved in
Q110: What is meant by the term "economic
Q119: Which of the following is not a
Q201: Table 4-7 Q202: Table 4-7 Q206: The graph below represents the market for Q207: Table 4-7 Q208: Table 4-7 Unlock this Answer For Free Now! View this answer and more for free by performing one of the following actions Scan the QR code to install the App and get 2 free unlocks Unlock quizzes for free by uploading documents
![]()
![]()
![]()
![]()

