Multiple Choice
Table 4-8
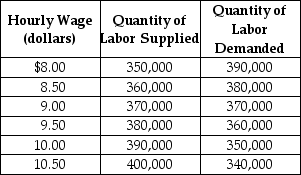 Table 4-8 shows the demand and supply schedules for the low-skilled labor market in the city of Westover.
-Refer to Table 4-8. Suppose that the quantity of labor supplied increases by 40,000 at each wage level. What are the new free market equilibrium hourly wage and the new equilibrium quantity of labor?
A) W = $9.00; Q = 410,000
B) W = $9.50; Q = 420,000
C) W = $8.50; Q = 400,000
D) W = $8.00; Q = 390,000
Correct Answer:
Verified
Related Questions

