Multiple Choice
Figure 8-11
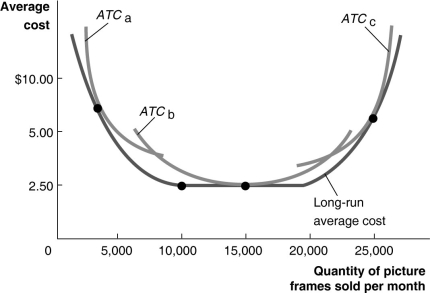 Figure 8-11 illustrates the long-run average cost curve for a firm that produces picture frames. The graph also includes short-run average cost curves for three firm sizes: ATCₐ, ATCb and ATCc.
-Refer to Figure 8-11.In the short run,if the firm sells fewer than 5,000 picture frames per month
A) it should produce with the scale of operation associated with ATCₐ.
B) it should produce with the scale of operation associated with ATCb.
C) it should produce with the scale of operation associated with ATCc.
D) it will experience constant returns to scale.
Correct Answer:
Verified
Related Questions
Q223: The president of Toyota's Georgetown plant was
Q230: The president of Toyota's Georgetown plant was
Q236: Over the past twenty years, the number

