Multiple Choice
Figure 9-12
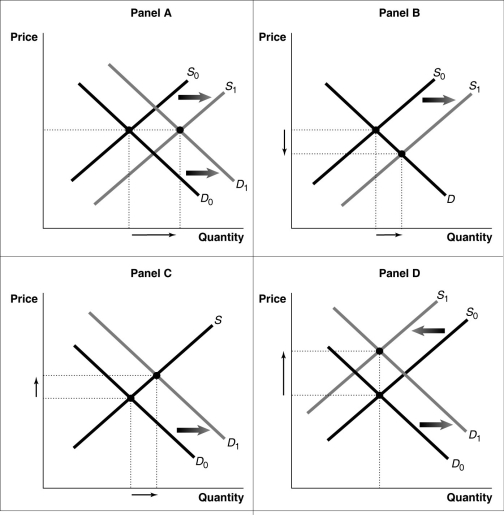
-Refer to Figure 9-12.Consider a typical firm in a perfectly competitive industry that makes short-run profits.Which of the diagrams in the figure shows the effect on the industry as it transitions to a long-run equilibrium?
A) Panel A
B) Panel B
C) Panel C
D) Panel D
Correct Answer:
Verified
Related Questions
Q204: If in a perfectly competitive market, firms
Q205: Figure 9-13 Q206: Werner & Sons is a manufacturer Q207: Use a graph to show the demand,
![]()

