Figure 9-18
-Refer to Figure 9-18.Use the figure above to answer the following questions.
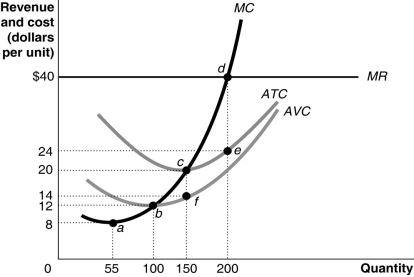
a.How can you determine that the figure represents a graph of a perfectly competitive firm? Be specific; indicate which curve gives you the information and how you use this information to arrive at your conclusion.
b.What is the market price?
c.What is the profit-maximizing output?
d.What is total revenue at the profit-maximizing output?
e.What is the total cost at the profit-maximizing output?
f.What is the profit or loss at the profit-maximizing output?
g.What is the firm's total fixed cost?
h.What is the total variable cost?
i.Identify the firm's short-run supply curve.
j.Is the industry in a long-run equilibrium?
k.If it is not in long-run equilibrium,what will happen in this industry to restore long-run equilibrium?
l.In long-run equilibrium,what is the firm's profit maximizing quantity?
Correct Answer:
Verified
View Answer
Unlock this answer now
Get Access to more Verified Answers free of charge
Q254: A perfectly competitive firm in a constant-cost
Q255: Competition has driven the economic profits in
Q259: Figure 9-17 Q265: When firms exit a perfectly competitive industry, Q266: In the long run, perfectly competitive firms
![]()
Unlock this Answer For Free Now!
View this answer and more for free by performing one of the following actions

Scan the QR code to install the App and get 2 free unlocks

Unlock quizzes for free by uploading documents