Multiple Choice
Figure 10-2
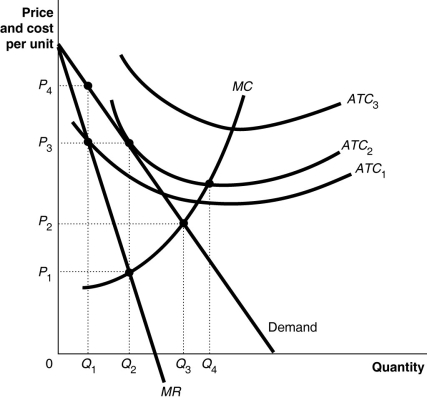 Figure 10-2 above shows the demand and cost curves facing a monopolist.
-Refer to Figure 10-2.To maximize profit,the firm will produce at output level
A) Q₁.
B) Q₂.
C) Q₃.
D) Q₄.
Correct Answer:
Verified
Related Questions
Q85: Identify four reasons for high entry barriers.Briefly
Q88: If a monopolist's price is $50 per
Q90: A monopolist's profit-maximizing price and output correspond
Q91: A virtuous cycle refers to the development
Unlock this Answer For Free Now!
View this answer and more for free by performing one of the following actions

Scan the QR code to install the App and get 2 free unlocks

Unlock quizzes for free by uploading documents