Multiple Choice
Figure 10-9
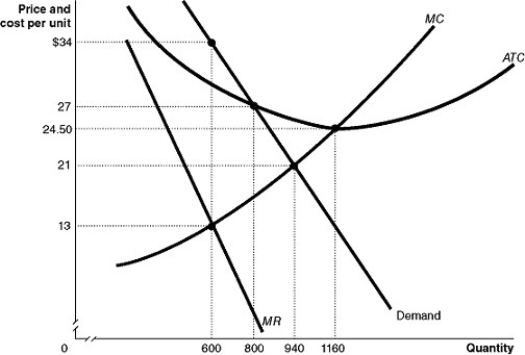 Figure 10-9 shows the demand and cost curves for a monopolist.
-Refer to Figure 10-9.What is the economically efficient output level?
A) 600 units
B) 800 units
C) 940 units
D) 1160 units
Correct Answer:
Verified
Related Questions
Q126: Firms that face downward-sloping demand curves for

