Figure 10-12
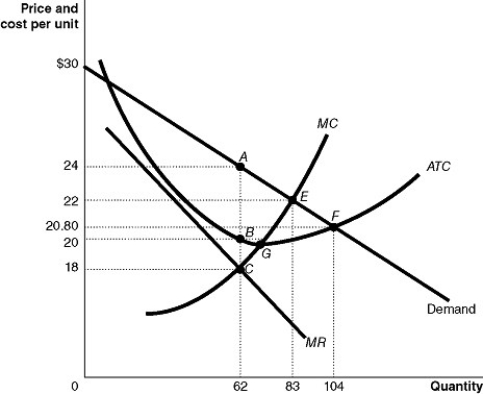 Figure 10-12 shows the cost and demand curves for a monopolist.
-Refer to Figure 10-12.Assume the firm maximizes its profits.What is the amount of the consumer surplus?
A) $21
B) $124
C) $186
D) $332
Correct Answer:
Verified
Q181: Arnold Harberger was the first economist to
Q184: A profit-maximizing monopoly produces a lower output
Q190: Arnold Harberger was the first economist to
Q193: Market power in the United States causes
Q194: Suppose a monopoly is producing its profit-maximizing
Q195: In reality, because few markets are perfectly
Q197: If the market for a product begins
Q199: The possibility that the economy may benefit
Q199: Figure 10-12 Q211: Suppose an industry is made up of
![]()
Unlock this Answer For Free Now!
View this answer and more for free by performing one of the following actions

Scan the QR code to install the App and get 2 free unlocks

Unlock quizzes for free by uploading documents