Figure 10-12
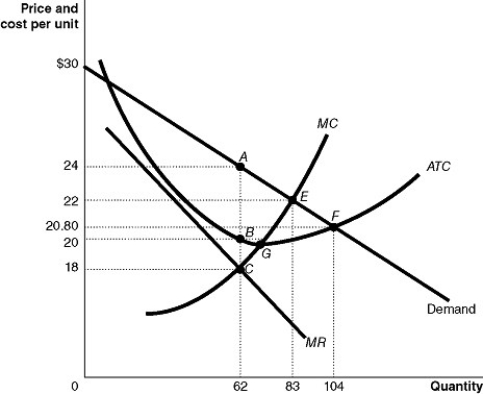 Figure 10-12 shows the cost and demand curves for a monopolist.
-Refer to Figure 10-12.If this industry was organized as a perfectly competitive industry,the market output and market price would be
A) output = 62; price = $24.
B) output = 83; price = $22.
C) output = 62; price = $18.
D) output = 104; price = $20.80.
Correct Answer:
Verified
Q164: Firms do not have market power in
Q166: A market economy benefits from market power
A)if
Q177: Figure 10-11 Q180: Figure 10-10 Q180: Assume a hypothetical case where an industry Q183: The only firms that do not have Q188: In evaluating the degree of economic efficiency Q192: Some economists believe that the economy benefits Q196: If a per-unit tax on output sold Q198: Which of the following statements is true?
![]()
![]()
A)If
Unlock this Answer For Free Now!
View this answer and more for free by performing one of the following actions

Scan the QR code to install the App and get 2 free unlocks

Unlock quizzes for free by uploading documents