Figure 10-14
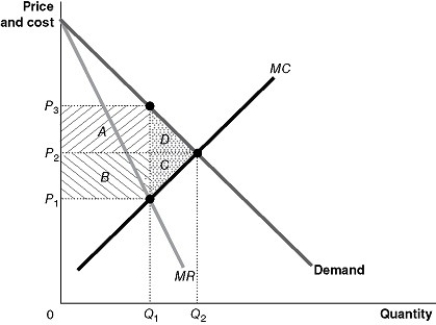
-Refer to Figure 10-14.From the monopoly graph above,identify the following:
a.The profit maximizing price
b.The profit maximizing quantity
c.The area representing deadweight loss
d.The area representing the transfer of consumer surplus to the monopoly
Correct Answer:
Verified
b∙Quantity = Q₁
c...
View Answer
Unlock this answer now
Get Access to more Verified Answers free of charge
Q203: A merger between the Ford Motor Company
Q205: Consider an industry that is made up
Q206: Producers in perfect competition receive a smaller
Q208: A Herfindahl-Hirschman Index is calculated by
A)summing the
Unlock this Answer For Free Now!
View this answer and more for free by performing one of the following actions

Scan the QR code to install the App and get 2 free unlocks

Unlock quizzes for free by uploading documents