Multiple Choice
Figure 10-16
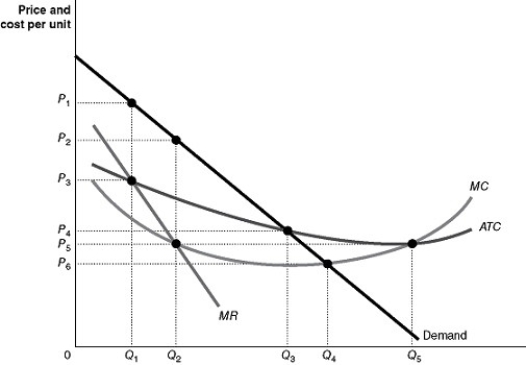 Figure 10-16 shows the market demand and cost curves facing a natural monopoly.
-Refer to Figure 10-16.If the regulators of the natural monopoly allow the owners of the firm to break even on their investment the firm will produce an output of ________ and charge a price of ________.
A) Q₁ units; P₄
B) Q₁ units; P₁
C) Q₅ units; P₃
D) Q₃ units; P₄
Correct Answer:
Verified
Related Questions
Q227: The Clayton Act is an antitrust law
Q229: Which antitrust law prohibited firms from buying
Q233: If a regulatory commission set a price

