Figure 11-8
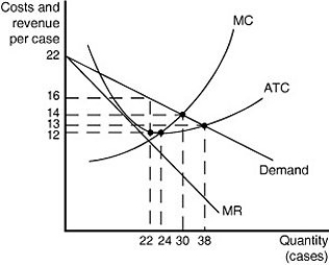 Figure 11-8 shows cost and demand curves for a monopolistically competitive producer of iced tea.
-Refer to Figure 11-8.Based on the diagram,one can conclude that
A) some existing firms will exit the market.
B) new firms will enter the market.
C) the industry is in long-run equilibrium.
D) firms achieve productive efficiency.
Correct Answer:
Verified
Q82: Suppose a monopolistically competitive firm's output where
Q103: If a perfectly competitive firm maximizes short-run
Q104: A monopolistically competitive firm should lower its
Q105: Unlike a perfectly competitive firm, a monopolistic
Q111: Figure 11-9 Q113: Figure 11-8 Q113: A profit-maximizing monopolistically competitive firm produces and Q116: Arturo runs a Taco Bell franchise.He is Q116: Figure 11-8 Q117: Figure 11-10 Unlock this Answer For Free Now! View this answer and more for free by performing one of the following actions Scan the QR code to install the App and get 2 free unlocks Unlock quizzes for free by uploading documents
![]()
![]()
![]()
![]()

