Essay
Figure 11-6
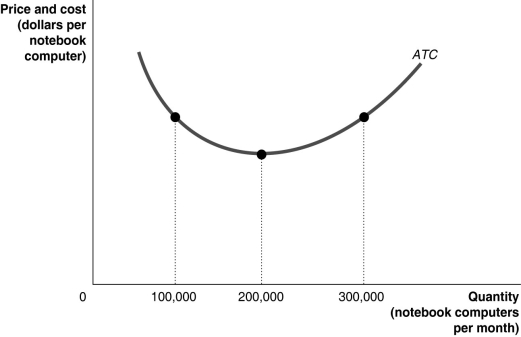
-Refer to Figure 11-6.Suppose the above graph represents the relationship between the average total cost of producing notebook computers and the quantity of notebook computers produced by Dell.On a graph,illustrate the demand,MR,MC,and ATC curves which would represent Dell maximizing profits at a quantity of 100,000 per month and identify the area on the graph which represents the profit.
Correct Answer:
Verified
Related Questions
Q82: Suppose a monopolistically competitive firm's output where
Q104: A monopolistically competitive firm should lower its
Q105: Unlike a perfectly competitive firm, a monopolistic

