Multiple Choice
Figure 15-4
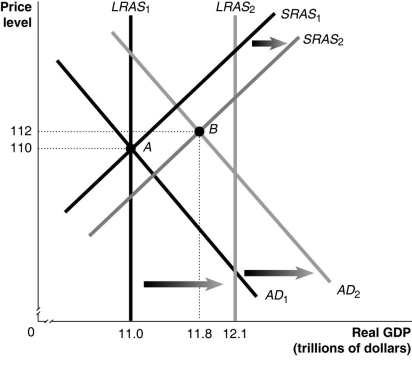
-Refer to Figure 15-4.In the figure above,LRAS₁ and SRAS₁ denote LRAS and SRAS in year 1,while LRAS₂ and SRAS₂ denote LRAS and SRAS in year 2.Given the economy is at point A in year 1,what is the growth rate in potential GDP in year 2?
A) 8%
B) 9.1%
C) 10%
D) 12%
Correct Answer:
Verified
Related Questions
Q207: Explain how the economy moves back to
Q227: Starting from long-run equilibrium,use the basic aggregate
Q231: Figure 15-4 Q232: When people became less concerned with the Unlock this Answer For Free Now! View this answer and more for free by performing one of the following actions Scan the QR code to install the App and get 2 free unlocks Unlock quizzes for free by uploading documents
![]()

