Figure 18-3
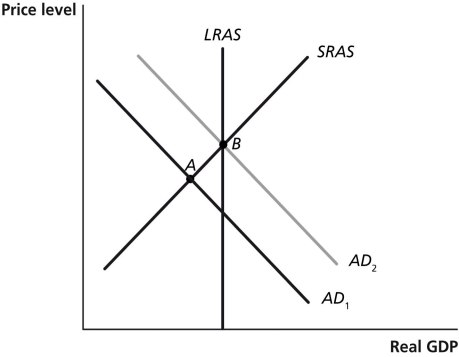
-Refer to Figure 18-3.In the graph above,suppose the economy is initially at point A.The movement of the economy to point B as shown in the graph illustrates the effect of which of the following policy actions by Congress and the president?
A) a decrease in income taxes
B) a decrease in interest rates
C) a decrease in government purchases
D) an increase in the money supply
Correct Answer:
Verified
Q63: Tax increases on business income decrease aggregate
Q67: Decreasing government spending _ the price level
Q68: Figure 18-4 Q68: Lowering the individual income tax rate will Q69: If the economy is growing beyond potential Q70: The problem causing most recessions is too Q74: A decrease in individual income taxes _ Q75: Expansionary fiscal policy to prevent real GDP Q77: Which of the following is an appropriate Q79: If the economy is falling below potential
![]()
Unlock this Answer For Free Now!
View this answer and more for free by performing one of the following actions

Scan the QR code to install the App and get 2 free unlocks

Unlock quizzes for free by uploading documents