Figure 18-11
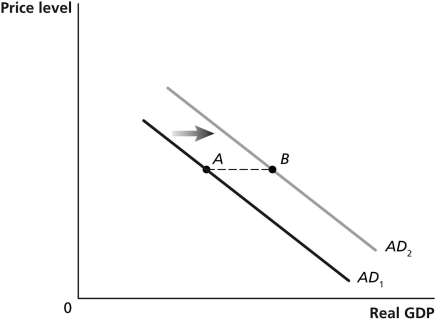
-Refer to Figure 18-11.In the graph above,the shift from AD₁ to AD₂ represents the total change in aggregate demand.If government purchases increased by $50 billion,then the distance from point A to point B ________ $50 billion.
A) would be equal to
B) would be greater than
C) would be less than
D) may be greater than or less than
Correct Answer:
Verified
Q124: The aggregate demand curve will shift to
Q125: Economists refer to the series of induced
Q131: The government purchases multiplier equals the change
Q133: Which of the following would increase the
Q136: The aggregate demand curve will shift to
Q138: A decrease in the tax rate will
Q139: Suppose real GDP is $12.6 trillion and
Q142: The multiplier effect is the series of
Q148: If Congress wanted to counteract the effects
Q153: The tax multiplier
A)is negative.
B)is larger in absolute
Unlock this Answer For Free Now!
View this answer and more for free by performing one of the following actions

Scan the QR code to install the App and get 2 free unlocks

Unlock quizzes for free by uploading documents