Short Answer
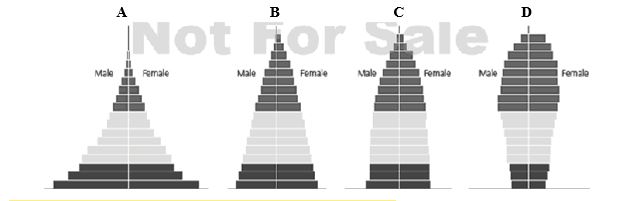
-Which age-structure diagram represents a declining population?
Correct Answer:
Verified
Related Questions
Q66: Populations can decline by increasing death rates.
Q73: Why is predation considered beneficial at the
Q90: Match the items listed below with the
Q91: Match the items listed below with the
Q105: Which stages in the amphibian life cycle
Q107: What is the major ecological difference between
Q108: How do keystone species differ from foundation
Q109: Describe how a plant species may get
Q111: Q115: ![]()
![]()
Unlock this Answer For Free Now!
View this answer and more for free by performing one of the following actions

Scan the QR code to install the App and get 2 free unlocks

Unlock quizzes for free by uploading documents