Using the graph pictured below that shows the tons of cod catch in the North Atlantic from 1900 on, match the appropriate letter with the description given. 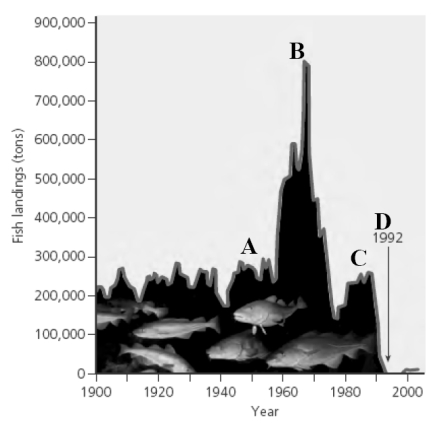
-What point on the graph represents the year when 20,000 fishermen and fish processors lost their jobs?
Correct Answer:
Verified
Q72: It has been estimated that up to
Q73: Recreation and jobs are two _ services
Q74: Costa Rica's largest source of income is
Q75: Today, forests in the United States cover
Q76: _ is a non-tree plant fiber from
Q78: One suggestion for sustainably managing fisheries is
Q79: The majority of deforestation on the planet
Q80: Definite priorities for protecting the world's remaining
Q82: List or describe at least five ways
Q91: You are the forest manager in a
Unlock this Answer For Free Now!
View this answer and more for free by performing one of the following actions

Scan the QR code to install the App and get 2 free unlocks

Unlock quizzes for free by uploading documents