Figure TB 11-1
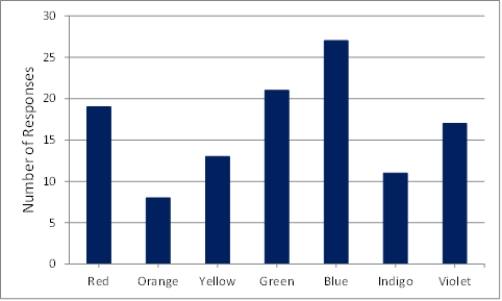
-What type of graph is shown in the accompanying figure?
A) bar chart
B) bivariate
C) pie
D) line
Correct Answer:
Verified
Q51: The level of statistical significance is also
Q52: What is the mean of this set
Q53: What is the median of this set
Q54: Tests to detect statistically significant differences are
Q55: What is the range of this set
Q57: A(n)_ is a summary of the frequency
Q58: The problem known as _ occurs when
Q59: If the scores on a test are
Q60: If the scores on a test are
Q61: List and describe the three steps typically
Unlock this Answer For Free Now!
View this answer and more for free by performing one of the following actions

Scan the QR code to install the App and get 2 free unlocks

Unlock quizzes for free by uploading documents