Figure TB 11-2
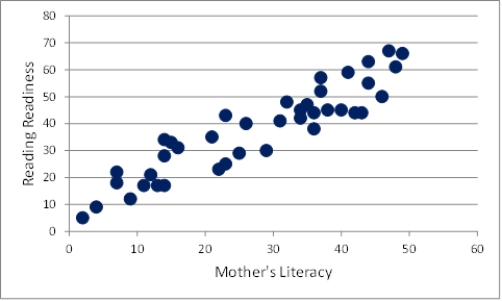
-What type of graph is shown above?
A) histogram
B) bivariate
C) pie
D) line
Correct Answer:
Verified
Q44: The probability that the researcher will conclude
Q45: The automated method for checking data-entry accuracy
Q46: Data _ includes developing and documenting a
Q47: Creating graphs and computing measures of central
Q48: Which correlation is used when there are
Q50: The correspondence between two variables is referred
Q51: The level of statistical significance is also
Q52: What is the mean of this set
Q53: What is the median of this set
Q54: Tests to detect statistically significant differences are
Unlock this Answer For Free Now!
View this answer and more for free by performing one of the following actions

Scan the QR code to install the App and get 2 free unlocks

Unlock quizzes for free by uploading documents