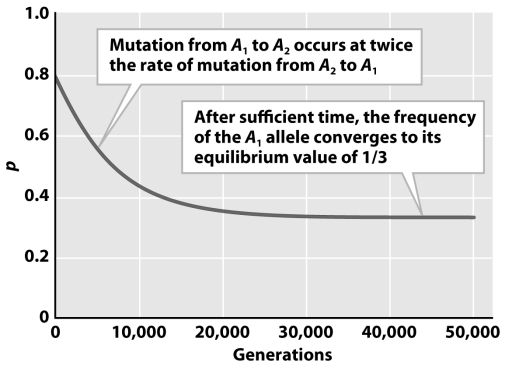
 The figure above depicts the change in p over time when the forward mutation rate is twice the reverse mutation rate.This results in a p equilibrium frequency that approaches 0.333.If the forward mutation rate was four times as fast as the reverse mutation rate,one would expect the equilibrium value of p to be
A) stable.
B) unstable.
C) lower than 0.33.
D) higher than 0.33.
E) A and C
Correct Answer:
Verified
Q3: Hardy and Punnett were two of the
Q4: The figure below demonstrates that 
Q5: Many early evolutionary biologists rejected Mendel's ideas
Q6: When considering the following figure,the top panel
Q7: Consider a biallelic locus with alleles A₁
Q9: Which assumption of the Hardy-Weinberg model is
Unlock this Answer For Free Now!
View this answer and more for free by performing one of the following actions

Scan the QR code to install the App and get 2 free unlocks

Unlock quizzes for free by uploading documents