Which of the following graphs depicts the group with the largest populations? Explain your reasoning. 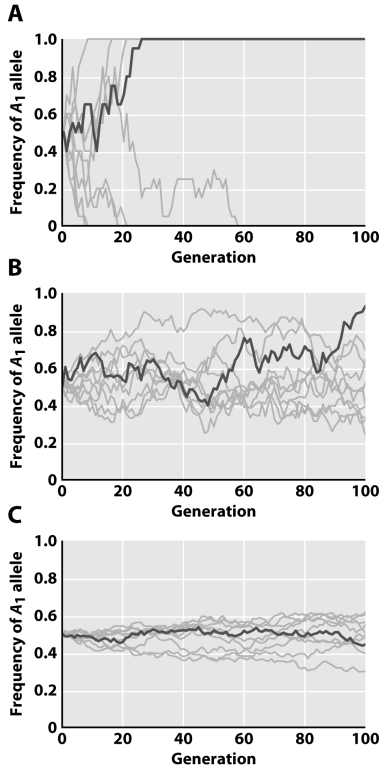
Correct Answer:
Verified
View Answer
Unlock this answer now
Get Access to more Verified Answers free of charge
Q28: The substitution rate is expressed in terms
Q29: The molecular clock has limited usefulness for
Q30: What are the observed and expected heterozygosities
Q32: It's well known that different lineages experience
Q35: Imagine that,of three species,it is known that
Q36: Greater prairie chickens,large birds related to grouse,once
Q37: Please describe the allele substitution rate in
Q38: At how many generations back do all
Q45: Explain why the probability of fixation of
Q49: How are the neutral theory of molecular
Unlock this Answer For Free Now!
View this answer and more for free by performing one of the following actions

Scan the QR code to install the App and get 2 free unlocks

Unlock quizzes for free by uploading documents