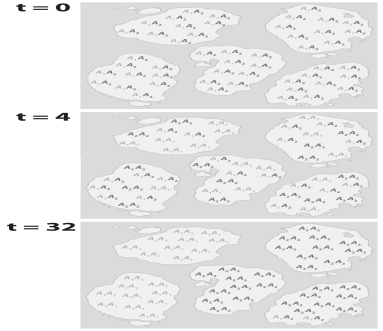
The figure below presents the genotypes of individuals in several island populations at three points in time (t = 0,t = 4,t = 32).What effect of genetic drift does this figure demonstrate?
Correct Answer:
Verified
View Answer
Unlock this answer now
Get Access to more Verified Answers free of charge
Q22: How do the data in the following
Q23: The nearly neutral theory
A)relaxes assumptions concerning the
Q24: A population of fruit flies is maintained
Q25: In which of the demographic patterns in
Q28: The substitution rate is expressed in terms
Q29: The molecular clock has limited usefulness for
Q30: What are the observed and expected heterozygosities
Q32: It's well known that different lineages experience
Q35: Consider a population of 10,000 pigeons founded
Q45: Explain why the probability of fixation of
Unlock this Answer For Free Now!
View this answer and more for free by performing one of the following actions

Scan the QR code to install the App and get 2 free unlocks

Unlock quizzes for free by uploading documents