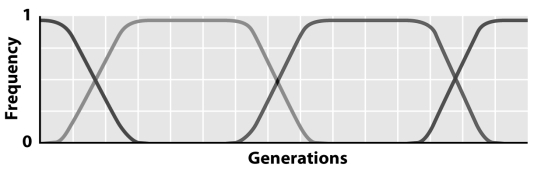
 In the figure above,each new line represents the frequency of a new beneficial mutation.The figure describes the process of
A) selective sweeps.
B) periodic selection.
C) genetic hitchhiking.
D) background selection.
E) A and B
Correct Answer:
Verified
Q1: Which of the following processes that can
Q2: If the value of linkage disequilibrium (D)is
Q3: A haplotype is
A)all of the alleles at
Q4: Selection can generate novel phenotypes by
A)drift causing
Q5: The observation of an offspring phenotype outside
Q7: In the figure below,the grey boxes represent
Q8: The statistical association of alleles at different
Q9: The following figure demonstrates the genotypic adaptive
Q10: Understanding phenotype-genotype relationships is difficult because of
A)pleiotropy.
B)dominance.
C)epistasis.
D)A
Q11: What two major concepts in biology were
Unlock this Answer For Free Now!
View this answer and more for free by performing one of the following actions

Scan the QR code to install the App and get 2 free unlocks

Unlock quizzes for free by uploading documents