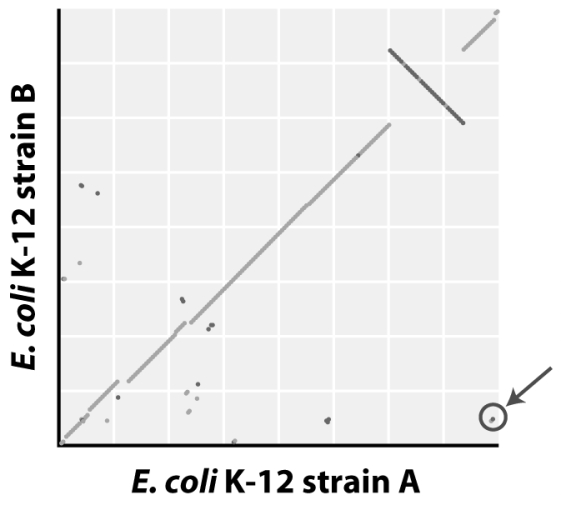
In the syntenic dot plot of E.coli K-12 strains A and B,there are two circled dots in the lower right corner of the plot.How do you interpret the position of these two dots in terms of the gene orders of the two strains?
Correct Answer:
Verified
View Answer
Unlock this answer now
Get Access to more Verified Answers free of charge
Q23: A researcher collects a soil sample and
Q26: In a 100 bp stretch of a
Q27: Describe a haplotype block.
Q28: The exon theory of genes states that
A)genes
Q29: Recombination rates across a chromosome
A)are highly variable.
B)are
Q31: Under the neutral model,allele frequency distributions are
Q33: The McDonald-Kreitman test compares substitution rates
A)between and
Q34: Explain how horizontal gene transfer is different
Q42: When comparing recombination rates between a dog,
Q49: Why are transposons considered selfish genetic elements?
Unlock this Answer For Free Now!
View this answer and more for free by performing one of the following actions

Scan the QR code to install the App and get 2 free unlocks

Unlock quizzes for free by uploading documents