The graph below shows the extinction rates for families of marine organisms over different periods of Earth's history.What is the best estimate for the background extinction rate given these data? 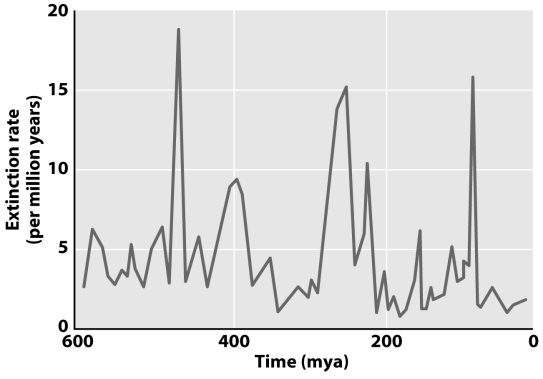
A) 14-20 families per million years
B) 8-12 families per million years
C) 2-5 families per million years
D) 2-20 families per million years
Correct Answer:
Verified
Q11: The probability of extinction via predation is
Q13: What is the hallmark trait of aquatic
Q14: Why are endemic species particularly endangered by
Q15: Data on extinction rates pre- and post-mass
Q17: Which mass extinction led to the disappearance
Q18: Approximately what percentage of marine species was
Q19: Which of the following is the greatest
Q20: What kinds of evolutionary trends are represented
Q21: You are a paleontologist studying the fossil
Q30: The earliest Homo sapiens fossils are about
Unlock this Answer For Free Now!
View this answer and more for free by performing one of the following actions

Scan the QR code to install the App and get 2 free unlocks

Unlock quizzes for free by uploading documents