The graph below shows extinction rates during different periods of Earth's history.How many mass extinction events do scientists commonly infer from these data? 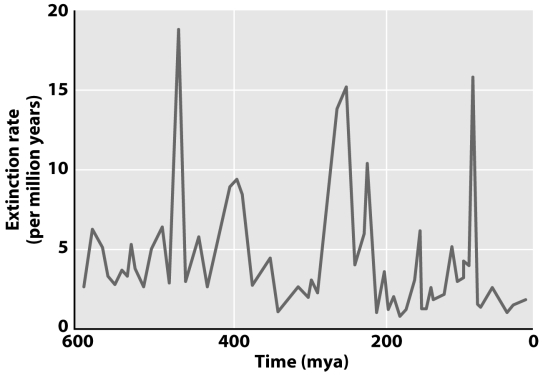
A) Two
B) Thirteen
C) Five
D) Three
Correct Answer:
Verified
Q2: Elevated levels of iridium are found in
Q3: Native plant A is endangered.You suspect that
Q4: While studying a group of ammonites (an
Q5: What is a sink population?
A)A large panmictic
Q6: Where would you place the actual extinction
Q8: The figure below shows the increasing morphological
Q9: Extinction of a species means that
A)all members
Q10: Which of the following conditions favor(s)fossilization?
A)A dead
Q11: The probability of extinction via predation is
Q30: The earliest Homo sapiens fossils are about
Unlock this Answer For Free Now!
View this answer and more for free by performing one of the following actions

Scan the QR code to install the App and get 2 free unlocks

Unlock quizzes for free by uploading documents