Figures A and B show the effect of an early- and a late-acting mutation on the lifetime fitness of individuals.Based on the graphs,how would you determine which of the two mutations had a greater effect on lifetime fitness? Limit your answer to one sentence. 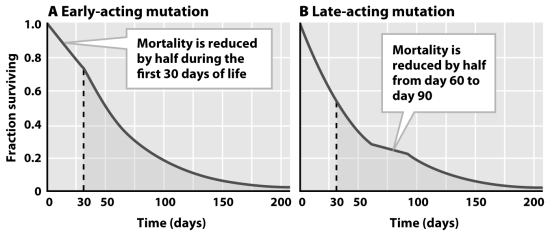
Correct Answer:
Verified
View Answer
Unlock this answer now
Get Access to more Verified Answers free of charge
Q17: Which of the following represents a similarity
Q18: Patients with severe bacterial sepsis who develop
Q19: Which part of the immune system's "learning
Q20: Ask a question about fever at each
Q22: Which of the two viral phylogenies below
Q23: What combination of the characteristics of Huntington's
Q25: Imagine two populations of snails that are
Q26: Individuals of a certain tree species experience
Q27: Can you think of examples,similar to the
Q49: Name three methods that pathogens use to
Unlock this Answer For Free Now!
View this answer and more for free by performing one of the following actions

Scan the QR code to install the App and get 2 free unlocks

Unlock quizzes for free by uploading documents