Multiple Choice
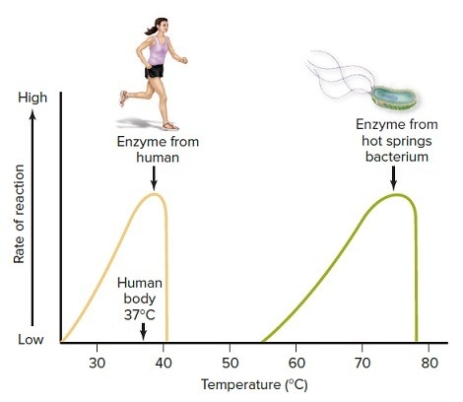
-The two data curves on the figure illustrate that
A) temperature ranges are not the same for all enzyme activity.
B) temperature is not related to enzyme efficiency.
C) optimal temperature ranges are the same for all enzymes.
D) pH is not related to enzyme efficiency.
E) All answers are correct.
Correct Answer:
Verified
Related Questions
Q24: After ATP donates a phosphate group to
Q25: Competitive inhibition of enzymes occurs
A) when a
Q26: The area on the enzyme where the
Q27: If you drop a rubber ball and
Unlock this Answer For Free Now!
View this answer and more for free by performing one of the following actions

Scan the QR code to install the App and get 2 free unlocks

Unlock quizzes for free by uploading documents