The graph below shows which of the following? 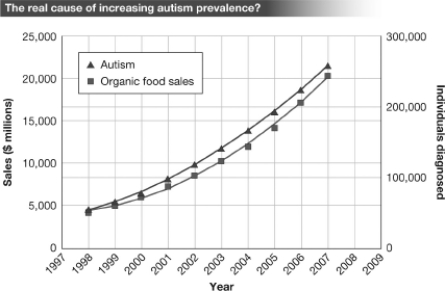
A) There is a strong correlation between the sale/consumption of organic food and the number of individuals diagnosed with autism between 1998 and 2007.
B) The increased consumption of organic food has led to an increase in the rate of autism between 1998 and 2007.
C) Consuming organic food causes autism.
D) There is strong evidence that a cause-effect relationship exists between the consumption of organic food and the development of autism.
Correct Answer:
Verified
Q16: Scientists at a major university are attempting
Q17: Which of the following statements about the
Q18: A research team funded by a pharmaceutical
Q19: An individual claims to be able to
Q20: Which of the following would be a
Q22: A scientific paper that combines results from
Q23: Rick has high blood pressure and decides
Q24: Observational studies that follow a particular group
Q25: When Lori was diagnosed with breast cancer,the
Q26: In the fall of 2012,a veterinarian from
Unlock this Answer For Free Now!
View this answer and more for free by performing one of the following actions

Scan the QR code to install the App and get 2 free unlocks

Unlock quizzes for free by uploading documents