The graph below indicates that global temperatures have 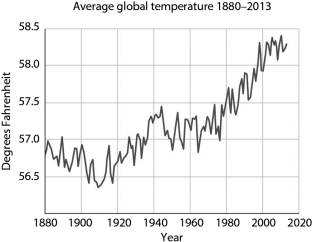
A) varied randomly over the last 160 years.
B) shown no real trend over the last 160 years.
C) tended to increase, especially in the last 100 years.
D) tended to decrease over the last 160 years.
Correct Answer:
Verified
Q30: Not all gases are greenhouse gases.A greenhouse
Q31: Global warming occurs
A) mainly at the equator.
B)
Q32: Greenhouse gases warm the planet by
A) absorbing
Q33: Decreasing _ would have the greatest effect
Q35: How much has Earth's mean surface temperature
Q36: There are many deserts at 30° latitude
Q37: One of the major effects of an
Q38: Historically,an unusual aspect of the recent rise
Q39: Which of the following choices is a
Q39: Which term encompasses all the others?
A) climate
Unlock this Answer For Free Now!
View this answer and more for free by performing one of the following actions

Scan the QR code to install the App and get 2 free unlocks

Unlock quizzes for free by uploading documents