The graph below shows the growth of a population of Paramecium caudatum.The greatest amount of daily growth occurred when the population was at approximately ________ percent of its carrying capacity. 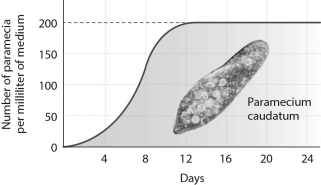
A) 10
B) 25
C) 50
D) 100
Correct Answer:
Verified
Q19: There were 250 elk in a population
Q19: The maximum population size that can be
Q20: According to the figure shown below,human populations
Q21: The carrying capacity for Paramecia caudatum as
Q22: Which of the following would likely occur
Q25: The decrease in the availability of food
Q26: When an isolated population reaches its carrying
Q27: If a population is growing with no
Q31: The effects of pollution are generally considered
Q40: Density-dependent factors are more likely to limit
Unlock this Answer For Free Now!
View this answer and more for free by performing one of the following actions

Scan the QR code to install the App and get 2 free unlocks

Unlock quizzes for free by uploading documents