The figure below shows that the human population was small and relatively stable for nearly 12,000 years but has increased dramatically in the past 200 years.How might this increase in population growth be explained? 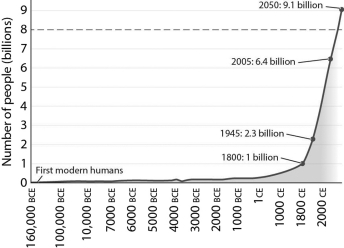
A) Disease prevented any significant growth of the human population.
B) For most of human history people were too malnourished to have children.
C) People simply chose to have fewer children in the past than at present.
D) Prior human populations were at existing carrying capacities, but newly developed technologies have raised the carrying capacity and permitted the recent expansion.
Correct Answer:
Verified
Q23: For most populations,irregular fluctuations in size or
Q32: Which of the following populations would be
Q34: Which of the following statements about carrying
Q35: In the figure below,the willow tree population
Q36: Which of the following situations illustrates a
Q36: Is it reasonable to expect that all
Q38: In 1978,a drought on the Galapagos Islands
Q39: According to the figure below,human populations are
Q41: In a neighborhood in Rio de Janeiro,the
Q42: Predation increases are responsible for density-_ changes
Unlock this Answer For Free Now!
View this answer and more for free by performing one of the following actions

Scan the QR code to install the App and get 2 free unlocks

Unlock quizzes for free by uploading documents