The following figure shows the marginal cost curve (MC) for a firm producing fancy dolls for children.The market price for a doll is $4 per unit.
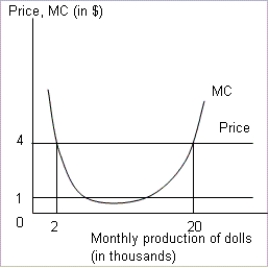
-Refer to Figure .Identify the correct statement from the following.Assume that the firm is trying to maximize profit and faces a $4 market price for dolls.
A) The firm will produce 2,000 dolls per month.
B) The firm's profit declines as the firm expands production beyond 2,000 dolls per month.
C) The firm's profit rises as the firm expands production beyond 20,000 dolls per month.
D) The firm will produce 20,000 dolls per month.
Correct Answer:
Verified
Q32:
The following figure shows two isocost
Q33:
The following figure shows the marginal cost
Q34:
The following figure shows two isocost
Q35:
The following figure shows the cost curves
Q36: An isocost line depicts:
A)the minimum cost required
Q38:
The following figure shows the cost curves
Q39:
The following figure shows two isocost
Q40: Which of the following is a property
Q41: The greater the curvature of the isoquant:
A)the
Q42:
The following figure shows three different plant
Unlock this Answer For Free Now!
View this answer and more for free by performing one of the following actions

Scan the QR code to install the App and get 2 free unlocks

Unlock quizzes for free by uploading documents