The following figure shows the cost curves of a firm producing good X.
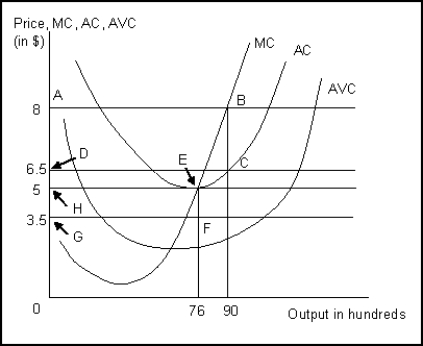
-Refer to Figure. The area EFGH is:
A) the loss incurred by the firm when market price is $3.5.
B) the profit earned by the firm when the market price is $3.5.
C) the loss incurred by the firm when the market price is $5.
D) the revenue earned by the firm when the market price is $5.
Correct Answer:
Verified
Q18: The marginal cost curve intersects the average
Q19: If all inputs are raised by equal
Q20: Investments with _ risk usually carry a
Q21: Isoquants reflect the fact that in the
Q22: Jeff owns a garage and has 3
Q24: A firm uses two inputs, labor (L)
Q25:
The following figure shows the marginal cost
Q26: _ gives the slope of an isocost
Q27: The gap between average total cost and
Q28: The market price of the product produced
Unlock this Answer For Free Now!
View this answer and more for free by performing one of the following actions

Scan the QR code to install the App and get 2 free unlocks

Unlock quizzes for free by uploading documents