The following figure shows the cost curves of a firm producing good X.
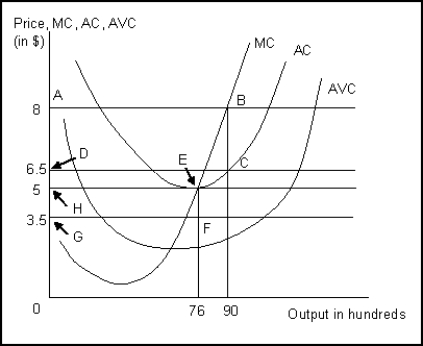
-Refer to Figurer. Identify the supply curve of the firm.
A) It is given by the MC curve.
B) It is given by the vertical axis for price below minimum AVC and the upward-sloping portion of the MC curve for prices above minimum AVC.
C) It is given by the vertical axis for price below minimum AC and the upward-sloping portion of the MC curve for prices above minimum AC.
D) It is given by the portion of the MC above point E.
Correct Answer:
Verified
Q33:
The following figure shows the marginal cost
Q34:
The following figure shows two isocost
Q35:
The following figure shows the cost curves
Q36: An isocost line depicts:
A)the minimum cost required
Q37:
The following figure shows the marginal cost
Q39:
The following figure shows two isocost
Q40: Which of the following is a property
Q41: The greater the curvature of the isoquant:
A)the
Q42:
The following figure shows three different plant
Q43: Discuss the relation between average variable cost
Unlock this Answer For Free Now!
View this answer and more for free by performing one of the following actions

Scan the QR code to install the App and get 2 free unlocks

Unlock quizzes for free by uploading documents